When Zorro set out to build a better ICHRA experience, our mission was clear: make it easy for employees to choose health coverage that actually works for their unique needs.
Not everyone was convinced. Skeptics argued that employees couldn't handle the complexity, that they'd make poor decisions without employer guidance, and that consumer-directed healthcare was a nice theory that would fail in practice.
Our 2026 open enrollment data tells a different story.
Last year definitely tested the model. Enhanced ACA subsidies expired. Premiums jumped 26% nationwide. But instead of chaos, we saw something encouraging: employees made thoughtful, diverse choices that reflected their actual needs — and not necessarily what brokers or employers assumed they wanted.
Our analysis of Zorro’s 2026 open enrollment data — representing employees across 50 states plus Washington, D.C. — reveals a range of findings that might challenge conventional wisdom about consumer-directed healthcare:
- Employees made diverse, informed choices - They selected plans from more than 100 carriers, with preferences spread across metal tiers and network types.
- Decision support enabled confident selections - 84% of employees were able to select their plans without accessing live support, up from 75% in 2025.
- Employee-reported plan selection priorities revealed nuanced trade-offs - While most employees prioritized lower costs, many employees also value minimizing risk and keeping their existing doctors or medications.
The bottom line: The skeptics were wrong. Pair empowered choice and smart decision support, and ICHRA works.
Employee population analysis
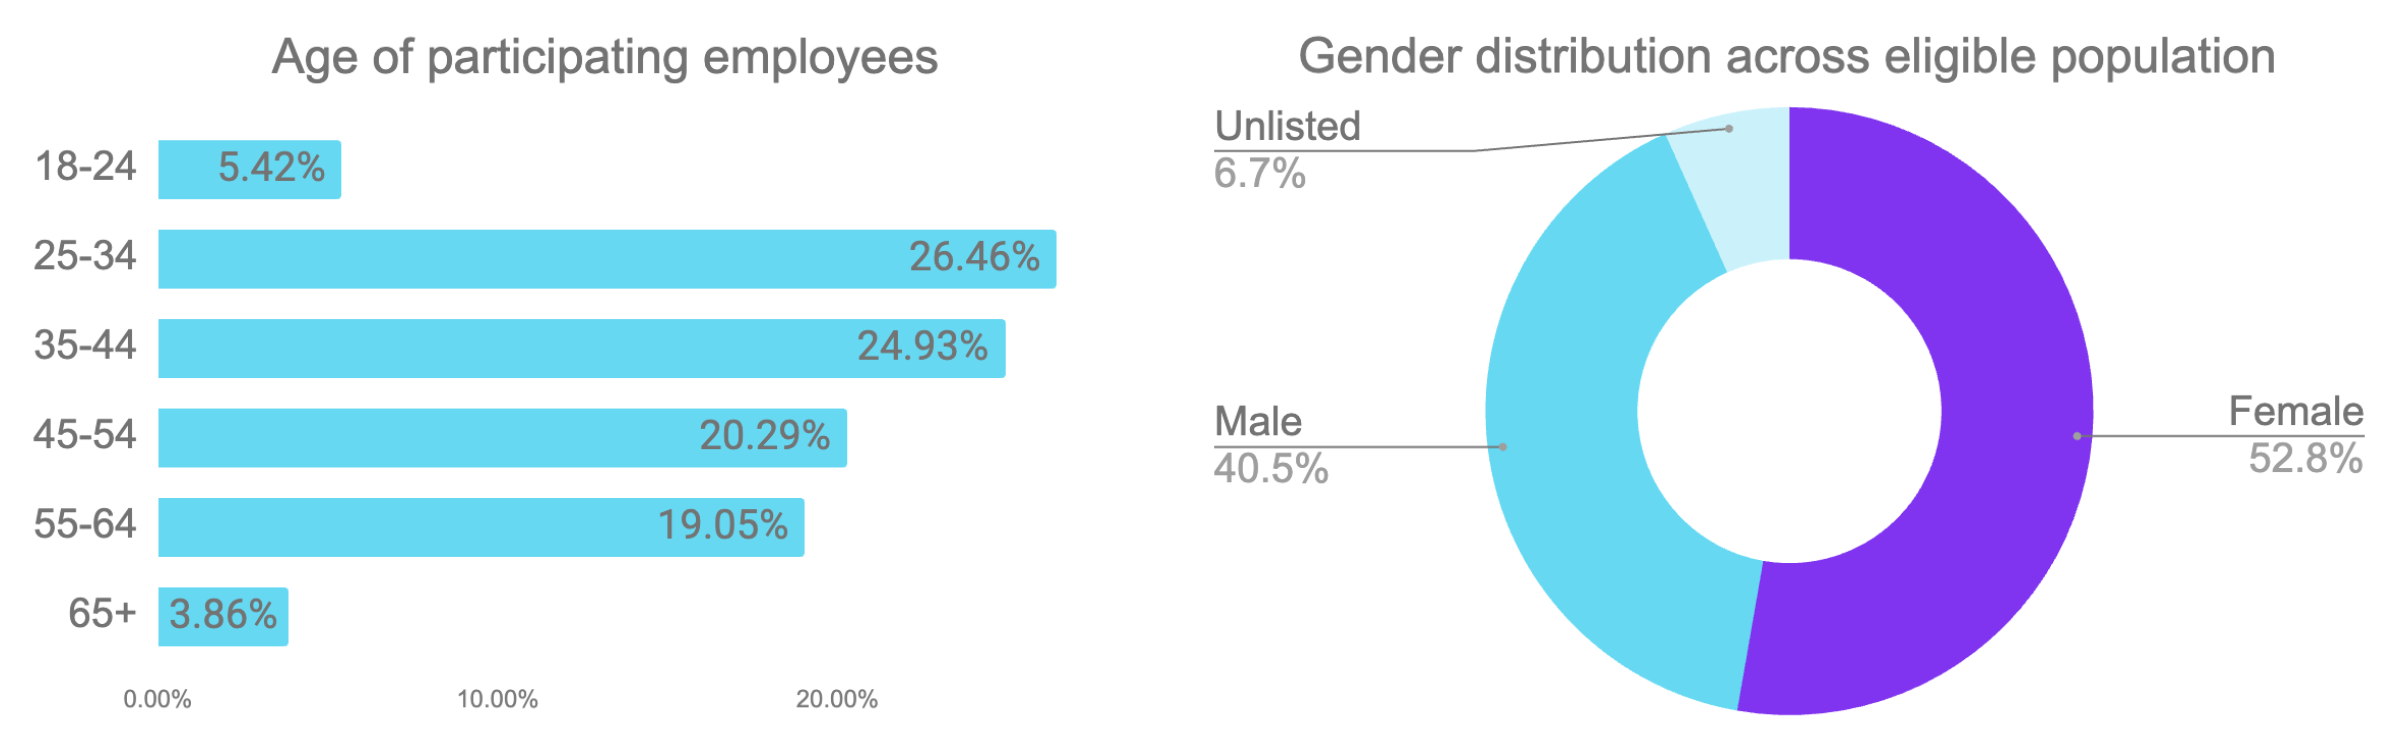
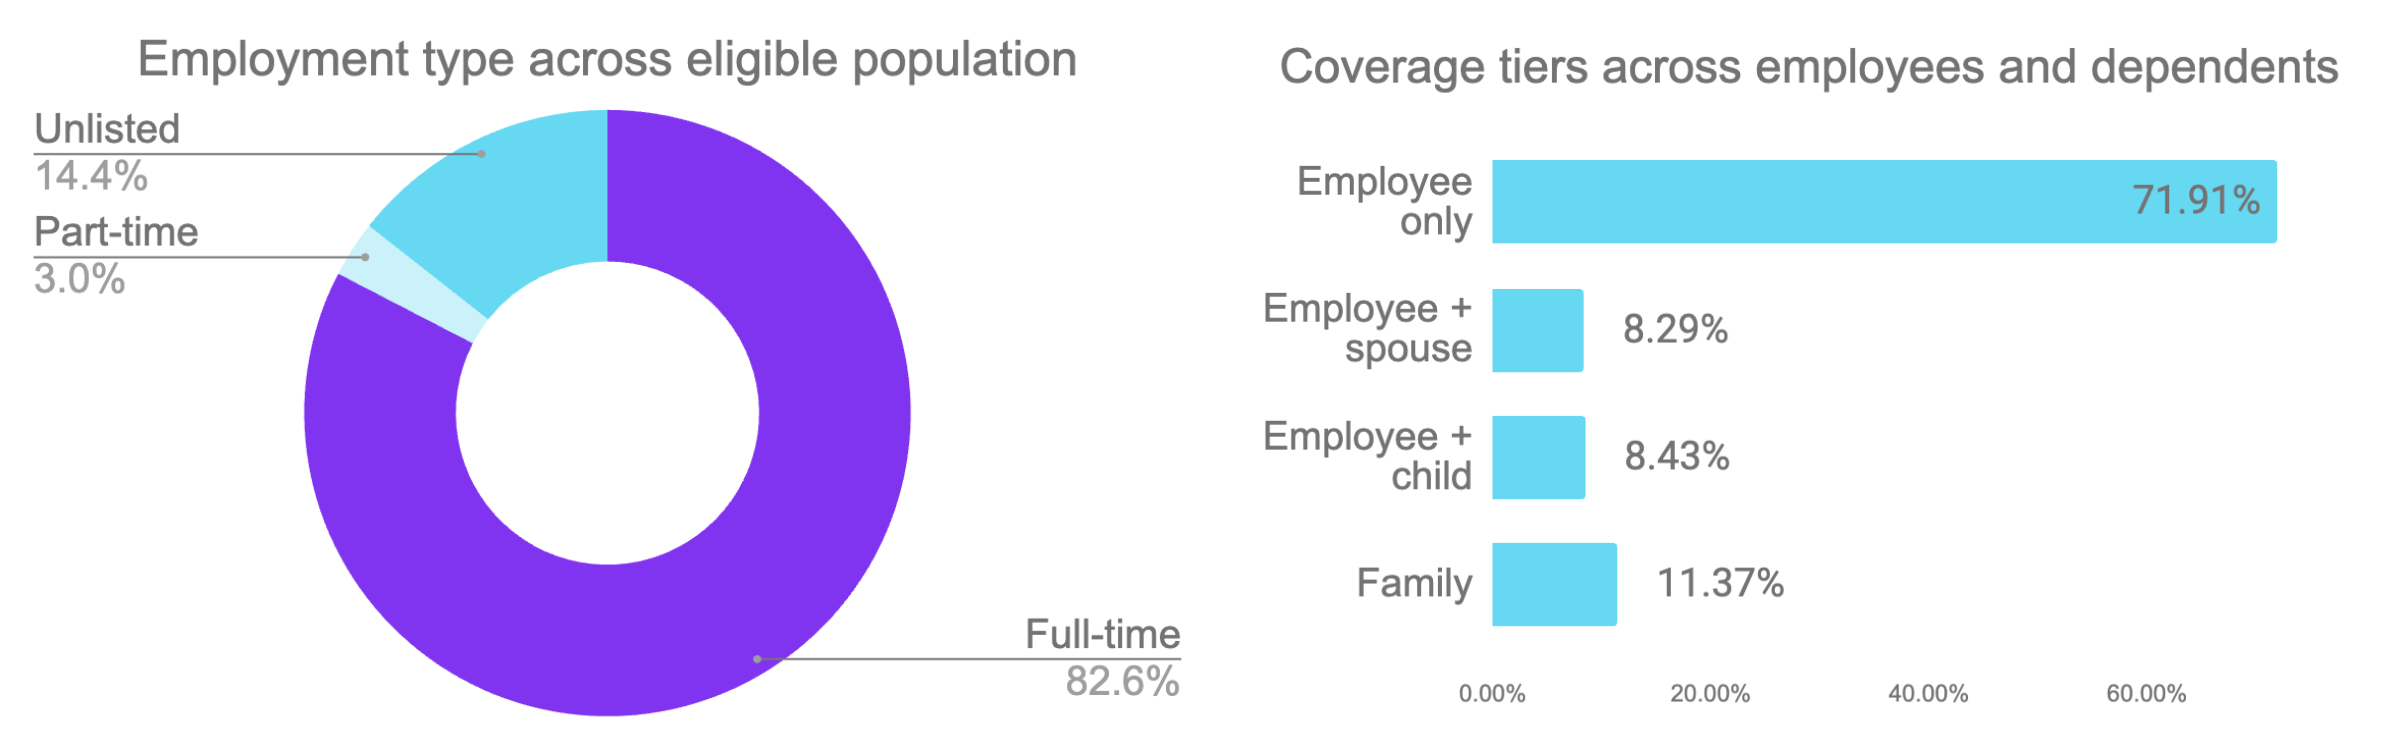
.png&w=3840&q=100)
I. Employees made diverse, informed choices
To better understand how ICHRA enables genuine consumer choice, look no further than employee decision data. If employees were defaulting to familiar paths, following employer nudges, or making random selections, we'd see concentration around a few dominant choices. Instead, we observe distribution across every dimension analyzed.
Metal tier recalibration
We saw a significant shift in how employees chose their metal tiers. Gold dropped 15 percentage points (55% → 40%). Bronze jumped 5 points (25% → 30%). That's a notable change in how people are weighing monthly premiums against potential out-of-pocket costs.
But here's what's not happening: a race to the cheapest option. Over two-thirds of employees (70%) still chose Silver, Gold, or Platinum. Four in ten stuck with Gold coverage.
What we're seeing is nuance. Some employees with lower healthcare needs saw Bronze's lower premiums as smart economics. Others prioritized comprehensive coverage and stayed with Gold or Silver. Different circumstances, different choices.
That's exactly what ICHRA is supposed to enable — and the metal tier distribution proves employees are using that flexibility thoughtfully.
HMO vs PPO: Conventional wisdom, flipped on its head
HMO selection jumped from 38% to 53% — a 15-point increase. Meanwhile, PPO barely budged, moving from 28% to 31%.
This may come as a surprise with what most people know about traditional plan design. Brokers have historically pushed hard for more PPO options, assuming employees wanted the broadest possible networks. Carriers listened and built PPO products. But not as many employees ended up choosing PPOs as brokers anticipated.
Why HMOs may be preferred by employees:
- Better value. HMOs deliver comprehensive coverage at lower premiums. When you're spending your own dollars (even if reimbursed), that math matters.
- Personalized networks. Employees don't need access to every doctor in America. They need access to their doctors. With ICHRA, each family picks the carrier that covers their specific providers. Broader isn't always better.
- Real-world priorities. Given the choice, most employees opted for predictable costs over theoretical network flexibility they'd likely never use.
The takeaway: Employees make rational choices when you give them the tools and let them decide. What they choose might surprise you — but it's what actually works for their households.
Carrier loyalty held strong (despite premium increases)
Average premiums jumped 26% in 2026. You'd expect employees to shop aggressively for savings. Yet 64% of returning employees stuck with the same carrier they had the year before.
Here's the breakdown: 37% kept their exact same plan. Another 27% stayed with their carrier but switched to a different plan — maybe dropping from Gold to Silver, or moving from a PPO to an HMO to manage the premium increase. Only 31% switched carriers entirely.
Why the loyalty? A few things could be driving it:
- Employees who had good experiences (smooth claims processing, responsive customer service, solid provider networks) may have been willing to pay a bit more rather than start over with an unknown carrier.
- Provider continuity matters. If your family has established care relationships, especially for chronic conditions, switching carriers (and potentially switching doctors) is a bigger deal than absorbing a premium increase.
That 27% who switched plans within their carrier? They may have recognized the premium increase as a chance to optimize — adjusting their coverage level while keeping their doctors and their carrier relationship intact. Cost-conscious, but strategic about it.
As for the 31% who switched to a different carrier, the question remains: Were they primarily chasing cost savings, or were there other factors at play? Of those who switched, 17% saw their premium decrease, while 83% saw their premium increase. However, it’s likely that they avoided steeper increases had they stayed with the same carrier. They could have also made the decision to change based on other factors, such as better network access, lower out-of-pocket costs, or broader coverage.
II. Decision support enabled confident choices
One of the most persistent objections to ICHRA has been the complexity argument: "Employees can't handle choosing their own health insurance. They'll make bad decisions, get overwhelmed, and blame their employer." This assumes healthcare decision-making requires professional expertise that typical employees lack. Our 2026 data thoroughly refutes this concern.
Self plan selection increased 9 points year-over-year
Eighty-four percent of employees selected their health plan during open enrollment without ever accessing live support. This represents a 9-percentage-point increase from 2025's already-impressive 75% self-enrollment rate.
This isn't employees settling for suboptimal coverage or making rushed decisions. It reflects the effectiveness of AI-powered decision support tools that translate complex insurance concepts into understandable trade-offs.
How Zorro makes confident self-selection possible
The high self-enrollment rate stems from several technological capabilities working in concert:
- Personalized recommendations: Zorro's proprietary AI analyzes thousands of data points — including age, location, household size, provider preferences, and prescription needs — to recommend the 3-5 plans most likely to meet each employee's needs.
- Plain-language explanations: Instead of insurance jargon (actuarial value, coinsurance, formulary tiers), employees see clear descriptions of what plans cover, how networks work, and what costs they can expect based on their anticipated utilization.
- Provider and pharmacy matching: Employees can verify that their current doctors and medications are covered before selecting a plan, reducing uncertainty and post-enrollment surprises.
- Conversational AI chat bot: Employees can ask questions in plain language and get instant, personalized answers about plan options, coverage details, and costs. The AI can guide employees through complex scenarios without requiring them to navigate insurance terminology or wait for a human specialist.
When they needed it, 16% chose to access human support
Some employees just prefer talking to a person. And that's completely valid.
Sixteen percent of employees chose to speak with a Zorro specialist during their enrollment. Not necessarily because their situation was complex — though some were navigating chronic conditions, multi-state families, or unusual provider networks. Often, they just wanted the reassurance of talking through their options with someone who could answer questions in real time.
That's why Zorro combines AI-powered tools with human expertise. Most employees feel confident navigating with the platform alone. But for anyone who wants personalized guidance — whether their situation is objectively complex or they simply prefer human interaction — our specialists are there to help.
It's not about one approach being better than the other. It's about meeting people where they are and giving them the support they need to feel confident in their choice.
III. Employee-reported plan priorities revealed nuanced trade-offs on cost, risk, and access
As part of the enrollment process, Zorro's platform asks employees to rank their top three plan priorities from this list:
- Minimizing my “all-in costs”
- Reducing the risk of large, unexpected expenses
- Keeping my providers
- Having my regular medications covered
- Seeing specialists without referrals
These rankings then inform their personalized plan recommendations — and also reveal what they value most when it comes to choosing a plan.
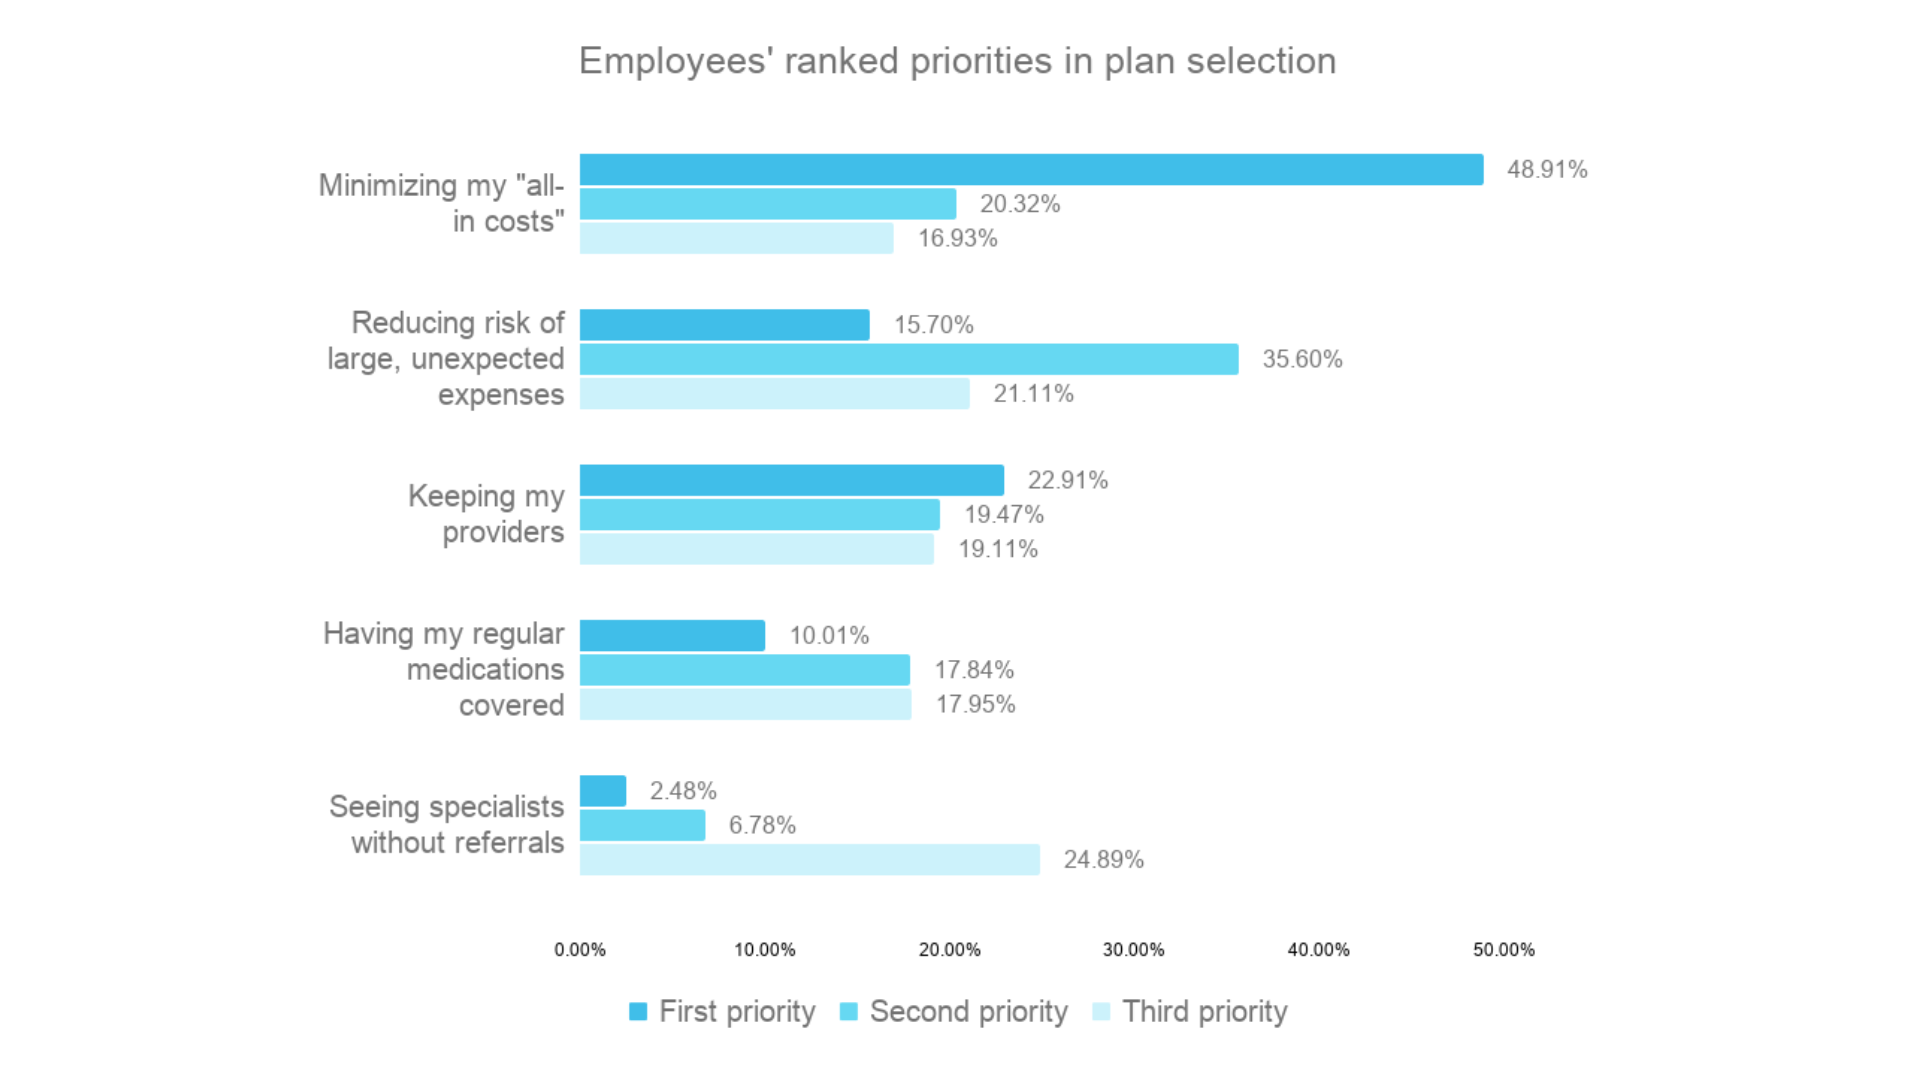
Employees want affordability — not just the cheapest option
Nearly half of employees (49%) ranked "minimizing my ‘all-in costs’" as their number one priority in plan selection. And with 20% of employees ranking “minimizing ‘all-in costs” as their second priority, and 17% as their third, the vast majority of employees considered it important.
But if cost was the end-all-be-all, we'd expect to see employees racing to the cheapest options available. Yet that's not what happened. Despite 49% ranking all-in costs as their top priority, only 30% chose Bronze plans.
Take a closer look at the wording: employees prioritized "all-in costs," not just premiums. They're considering the total amount they’d spend on their plan throughout the year — premium plus deductible plus out-of-pocket maximum. For someone who anticipates regular healthcare use, a Gold plan with a $200 higher monthly premium but a $3,000 lower out-of-pocket max may be the lower all-in cost.
This also explains why "reducing the risk of large, unexpected expenses" shows up as a strong secondary priority (36% chose it second, the largest jump of any option). Employees aren't making two separate calculations — one for cost, one for risk. They're making one holistic calculation: "What's my total potential spend, and how much protection do I need against catastrophic expenses?" Risk management is cost management for many employees — just on a longer time horizon than monthly premiums.
The pattern is clear: affordability guides their choices, but it doesn’t limit them. Employees are making sophisticated choices that make financial sense for their real-world needs.
Risk management is important to employees — but only after they secure basic affordability
"Reducing the risk of large, unexpected expenses" was ranked as a first priority by only 16%, but it jumps to 36% as a second priority — the largest increase of any option between rankings.
Coupled with “minimize all-in cost” as the top-reported first priority, this pattern suggests a specific decision-making sequence: employees want to find affordable coverage first, then protect themselves against catastrophic costs second.
Continuity of care is a top priority for only 1 in 4 employees
Nearly a quarter of all employees (23%) ranked "keeping my providers" as their #1 priority — more than twice the rate of "having my regular medications covered" (10%). On average, employees prioritized provider relationships over pharmacy access.
This has direct implications for how employers think about network disruption. The prevailing assumption goes like this: "If we change carriers and employees lose access to their doctors, we’ll be answering to a frustrated employee population. Provider continuity is a must-have."
But our data tells a different story. When employees face the actual trade-off between lower cost and keeping their doctors, cost wins 2:1. This doesn't mean provider access is unimportant. But it does mean it may not be the dealbreaker HR leaders assume it is.
That's why HMO plans — which accounted for 53% of 2026 network type selections — often make strategic sense. For many employees, an HMO that may not include their established providers but offer a lower premium is a better value than a PPO with a network they may or may not ever use.
Is the ability to see specialists without referrals as important as the industry thinks?
It depends on who you ask. The ability to see specialists without needing a primary care physician's approval first is often cited as a key reason employees prefer PPOs over HMOs.
But does this reflect employee prioritization data? Well, it wasn’t the average employee’s top priority — but it wasn’t off the radar entirely.
As a first priority, it captured just 2.5% of employee responses. As a second priority, 7%. But by the third priority, it jumped to 25%, making it the only option that increased with each ranking.
This increase is a clear signal of how employees actually rank “seeing specialists without referrals” alongside other priorities. Cost and keeping doctors decrease as you move down the rankings because employees who care deeply about them rank them first. "Seeing specialists without referrals" rankings increase because it's something people think "sure, that would be nice"... but few seem to consider it a dealbreaker.
This matters because benefits consultants often emphasize POS and PPO plans specifically for their lack of referral requirements. But if only 2.5% of employees prioritize this feature above cost, networks, or risk management, brokers may be overselling a benefit that doesn't drive real decision-making.
What this prioritization data tells us about consumer choice
These priority patterns reveal that employees can articulate what they need — and what they articulate is rational:
- They lead with cost because healthcare is expensive.
- They think about risk management as a secondary consideration because they're balancing trade-offs, not ignoring consequences.
- They prioritize keeping their doctors because established care relationships matter to them, but not at the expense of cost.
- They deprioritize features that sound good in theory but may not affect their day-to-day healthcare experience.
This is exactly the kind of thoughtful decision-making that ICHRA is designed to enable. When employees can express their priorities and tech-powered decision support tools translate those priorities into personalized plan recommendations, consumer choice works — not despite complexity, but because the right tools help people navigate it.
The skeptics who claim employees can't handle this level of decision-making aren't seeing what we see in the data. Employees aren't confused about what they want. They know what matters to them. They just need tools that help them turn those priorities into choices.
Strategies for the road ahead
Our 2026 OE data doesn't just tell us what happened when ICHRA was offered to employees across the country — it shows us what works. For brokers and HR leaders planning 2027 open enrollment or considering ICHRA for the first time, here are the strategic implications to keep in mind.
1. Expect smarter shoppers.
Between the shifts in metal tiers, carrier loyalty, and our self-selection rate, there are clear signs that when they’re given the right tools and guidance, employees are able to make sophisticated decisions for their own unique needs — exactly what ICHRA was built for.
2. Double down on decision support.
Even if employees can choose for themselves, that doesn’t mean they should do it completely alone. Zorro’s 84% self selection rate is evidence that tech-led decision support works. When people understand their options, they make better choices.
3. Prove value beyond cost.
Employers need better metrics for ICHRA success beyond "we spent less." Instead, consider the full picture:
- Employee satisfaction scores
- Retention rates year-over-year
- Support utilization patterns
- Carrier diversity
- Coverage continuity
These indicators show whether ICHRA is delivering the genuine value of choice.
The bottom line for 2027 (and beyond)
Our 2026 data validates that ICHRA works best when two conditions align:
- Employees have genuine choice (access to diverse carriers, metal tiers, and network types enables personalization)
- Decision support meets people where they are (AI tools + human assistance enable confident decisions)
The conversation has evolved from "Does ICHRA work?" to "How do we make it work well?" That shift — from existential doubt to operational optimization — signals a market moving from early adoption toward mainstream maturity.
For brokers and HR leaders approaching 2027 open enrollment planning and/or considering ICHRA for the first time, the opportunity is clear: ICHRA isn't a panic button for unsustainable renewals. It's a strategic benefits evolution that, when implemented thoughtfully, can serve diverse employee needs better than one-size-fits-none group insurance.
If rising group premiums, multi-state complexity, or the need for modern benefits tech sounds familiar, you're not alone. The companies in this analysis faced the same challenges — and found that ICHRA delivered results. Zorro's team can show you how a similar approach might work for your organization. Contact us to learn more.